Running the Software
Purpose of the Running the Software Section
The user guide already contains detailed instructions describing the functionality and usage of each tab in the application. In addition, Poriscope includes an in-application walkthrough (tutorial mode) that can be enabled to guide users interactively through the interface.
For an overview of the complete workflow, see Workflow Overview. Step-by-step guidance is also available in the interactive tutorial (Tutorial and Documentation) and in the dedicated sections for each tab, including Raw Data Tab, Event Analysis Tab, MetaData Tab, and Clustering Tab.
The Running the Software section serves a different purpose. Rather than explaining every feature in detail, it provides concrete inputs and expected outputs that allow users to confirm that the software is installed correctly and functioning as expected.
This section focuses on a practical, end-to-end validation workflow that primarily exercises the Raw Data tab. By following the steps, users should be able to reproduce specific, known results (for example, a fixed number of detected events over a given time range), which acts as a sanity check for the entire processing pipeline.
Relationship to the Tutorial Series
The workflow demonstrated here aligns with the YouTube Tutorial Series – Part 2: The Core Workflow, specifically the video titled Part 2: Section 2 - Exploring the Raw Data Tab:
https://www.youtube.com/watch?v=LdFBJ6Agwhs&t=775s
Notably, the tutorial series uses the same dataset throughout all steps of the workflow (from raw data loading to event writing). The Running the Software section mirrors this approach by reusing a consistent input file, making it easier for users to compare their results directly with those shown in the videos.
In summary, this section is intended as a verification walkthrough, not a feature reference: if users obtain the same intermediate views and final outputs, they can be confident that Poriscope is operating correctly.
Once you have installed Poriscope as described in the installation guide (see Getting Started), you can launch the application by following the steps below.
Launching Poriscope
Open a terminal.
Run the following command:
poriscope
Loading Data
Click Add Reader.
Select ChimeraReader20240501.
Click Select Input File and choose any
.logfile from the data directory:
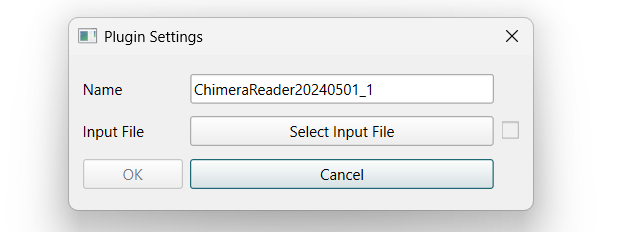
Click OK.
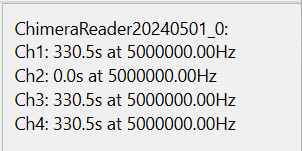
You should now see the loaded data in the right-side panel.
Visualizing a Trace
Select a channel.
Enter a duration.
Click Update Trace to visualize the signal.
Filtering the Signal
If needed, apply a filter before event detection.
In the tutorial series, a BesselFilter is used with the following settings:
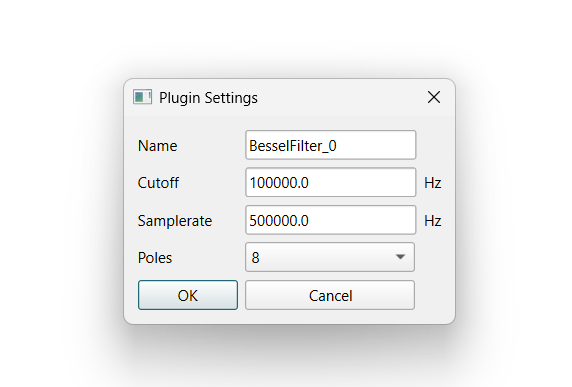
Event Finding
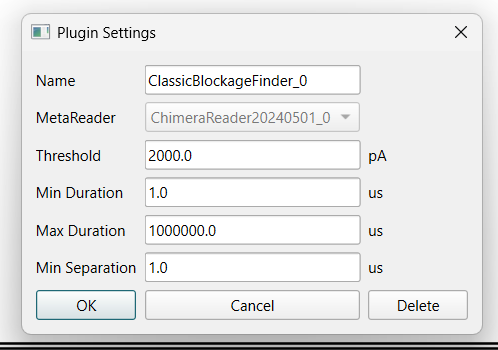
Once you are satisfied with the filtered trace, click Add Event Finder.
Select ClassicBlockageFinder.
Click OK.
Channel Selection Notes
Select the channel (or channels) on which you want to find events.
If you select Channel 2, event detection will be incomplete (Channel 2 is empty)
Refer to Time Event Finding if you want to restrict the time range used for event detection.
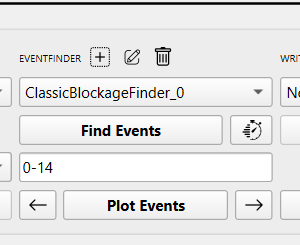
Example
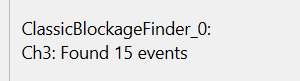
Using a time range of
0–50on Channel 3 should return 15 events.After detection, enter
0–14and plot the events.
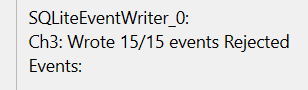
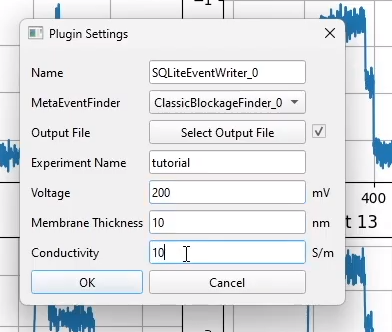
Writing Results
To save the results:
Add a Writer.
Enter the parameters as shown below:
Select the channel you want to save.
If you select Channel 3, you should see 15 events saved in the right-side panel.