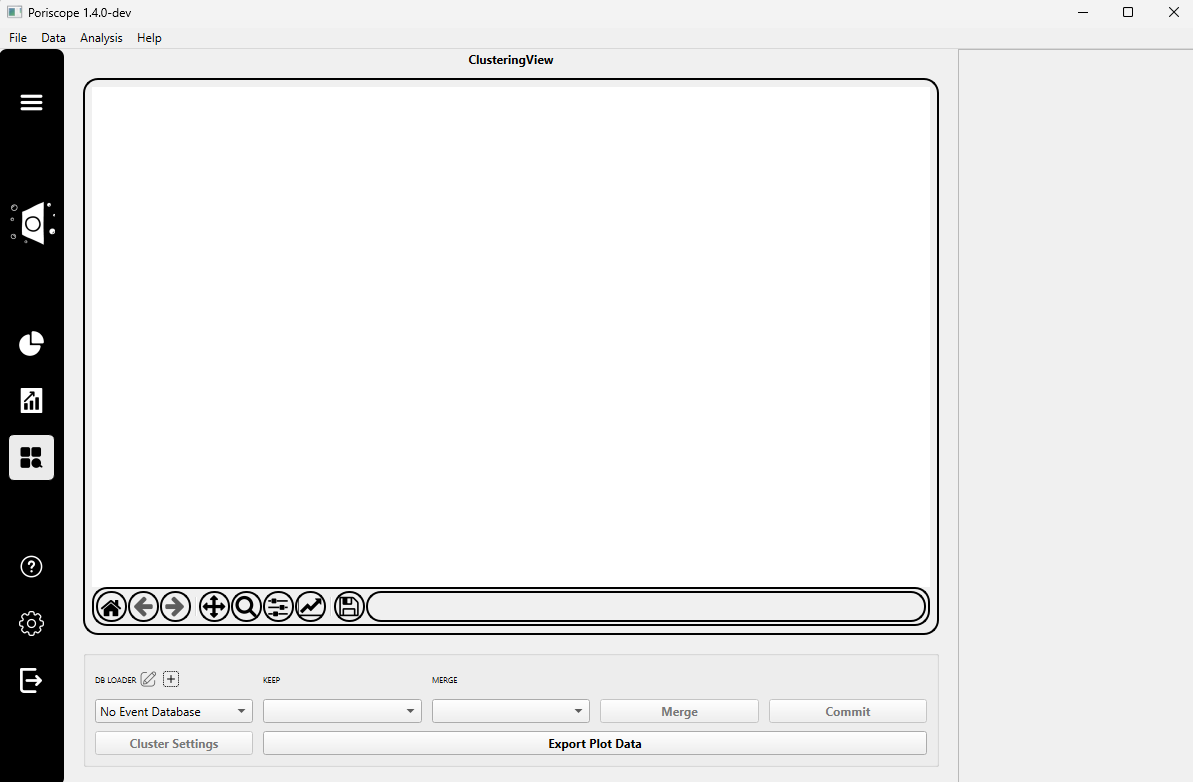
Clustering Tab
The Clustering Tab allows you to group similar events based on selected metadata features using clustering algorithms such as HDBSCAN and Gaussian Mixtures. It is designed to uncover patterns and groupings within large sets of fitted nanopore event data.
Step 1: Load Metadata Database
Click the ➕ DB Loader button to select your metadata SQLite database file.
If you have previously loaded DB files, they will automatically appear.
Step 2: Configure Clustering Settings
Click the Cluster Settings button.
Inside the dialog:
Select Method: Choose one of the following:
HDBSCAN:
HDBSCAN stands for Hierarchical Density-Based Spatial Clustering of Applications with Noise. It groups data points based on density and can automatically find clusters of varying shapes and sizes. It also labels low-confidence points as noise.
It requires the following parameters:
Cluster Size: The minimum number of points a group must contain to be considered a cluster. Larger values result in fewer, larger clusters.Min Points: Determines how conservative the algorithm is when defining cluster boundaries. A higher value increases the density required to form a cluster.Sensitivity: Adjusts how strict the algorithm is when identifying core cluster regions. Lower values make it easier to form clusters; higher values tighten the definition.
HDBSCAN is great for discovering natural groupings in your event data without needing to pre-specify the number of clusters.
Gaussian Mixtures:
Gaussian Mixture Models (GMMs) assume that the data is generated from a combination of several Gaussian (normal) distributions.
It requires the following parameter:
Number of Clusters: The number of Gaussian components (clusters) to fit to the data. You must specify this number manually.
GMMs work well when your data fits the assumption of normally distributed clusters and you have an idea of how many groups to expect.
Apply Filter (optional): Narrow down which events are included by writing a simplified SQL-like condition.
Example:
duration > 200 and max_blockage < 800Select Columns: Choose a metadata column to use for clustering.
You may optionally enable:
LOG: Apply log10 scaling.
NORM: Normalize using median absolute deviation.
PLOT: Include in the clustering visualization.
➕ Add Column: Once the column and options are selected, click the ➕ button to add it to the configuration.
Warning
If you do not click the ➕ button, your selected column will not be included in the clustering operation.
Click Apply to launch the clustering process, or Cancel to discard changes.
Step 3: Merge Clusters (Optional)
After clustering is complete:
Use the
KEEP LABELandMERGE WITHdropdowns to select two clusters.Click Merge to reassign all events in the
MERGEcluster to theKEEPcluster.
Step 4: Commit Cluster Labels
Click Commit to write the clustering results to your metadata database.
Adds two new columns:
cluster_labelandcluster_confidence.If the table already contains clustering data, you will be prompted before overwriting.
Step 5: Export Plot Data
Click Export Plot Data to save the current clustering visualization as a csv file.