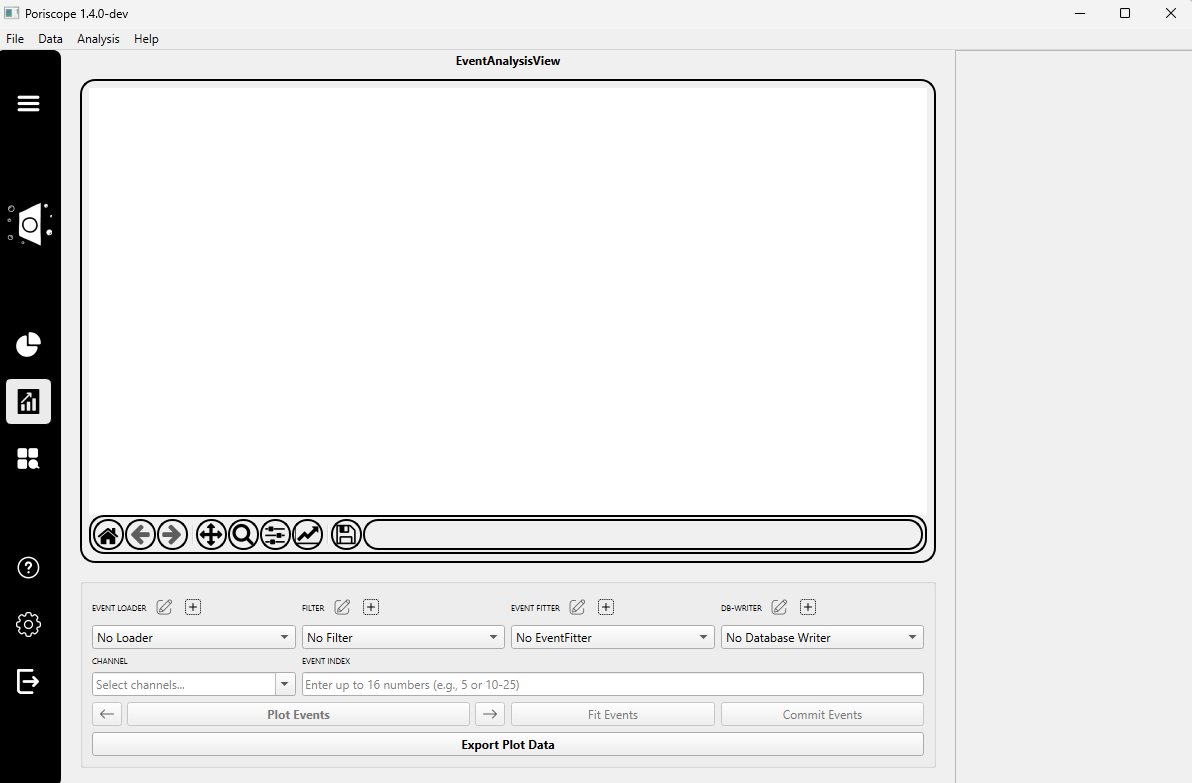
Event Analysis Tab
The Event Analysis Tab provides tools to analyze events previously detected in the Raw Data Tab. This includes loading a database of events, filtering and fitting them, and writing the results into a new or existing database.
Step 1: Load Event Database
Click the ➕ Load Database button to import an existing event database.
A dropdown menu will appear listing available loaders. For example:
SQLiteEventLoader_0– for loading .db files containing previously detected events.
A plugin settings dialog will appear. For
SQLiteEventLoader, you must:Enter a name for the loader (e.g.,
SQLiteEventLoader_1).Click Select Input File to browse for a valid .db file containing event data.
Note
Only databases created using the Commit Events functions in the Raw Data Tab are compatible with this loader.
Once the loader is configured, select the channel you’d like to work with from the dropdown.
(Optional) Enter one or more event indices or ranges (e.g.,
0-9,15,22-28) in the input field to preview specific events.Click the Plot Events button to visualize the selected entries.
Step 2: Apply a Filter
Create or Select a previously configured filter from the Filter dropdown.
(Optional) Re-enter indices and click Plot Events again to preview filtered results.
Note
Filters refine event shapes and reduce noise prior to fitting.
Step 3: Fit Events
Click the ➕ Add Fitter button to choose an event-fitting plugin.
A dropdown will appear with available fitters. Options include:
CUSUM– detects abrupt steps within events.IntraCUSUM– segments substructures inside events using hysteresis-based detection.PeakFinder– fits prominent peaks using window-based criteria.NanoTrees– identifies nested sublevels using time-scaling and statistical analysis.
A plugin settings dialog will appear depending on the selected fitter:
CUSUM Settings:
Name: Custom name for the fitter instance.Step Size(pA): Minimum change in current to detect.Rise Time(µs): Expected duration of a step change.Max Sublevels: Maximum number of levels to detect per event.
IntraCUSUM Settings:
All fields from
CUSUM.Intraevent Threshold(pA): Threshold for substructure detection.Intraevent Hysteresis(pA): Prevents minor fluctuations from being misclassified.
PeakFinder Settings:
Min Height/Min Prominence(pA): Define peak visibility.Relative Height: Fraction of signal height needed to qualify as a peak.Window Length(µs): Duration of analysis window.Width(µs): Expected peak width.Min Distance(µs): Time required between peaks.Max Unfolded: Maximum number of peak-like features allowed per event.
NanoTrees Settings:
Smallest Significant Sublevel(pA): Threshold for identifying a distinct level.Time Scaling: Adjusts time sensitivity in detection.Exceptional Sublevel Sensitivity: Lower values detect finer substructures.
Note
The optimal fitter depends on the event complexity. CUSUM is good for clean, stepped data; NanoTrees is best for hierarchical sublevel detection.
After confirming the settings, click OK.
Click the Fit Events button to begin analysis. Once complete, results are displayed in the right-side panel, including fitted and rejected events.
(Optional) Re-enter event indices and click Plot Events to view newly fitted entries.
Step 4: Write to Database
Click the ➕ Add Writer button to select a plugin for storing your fitted results.
A plugin settings dialog (e.g., for SQLiteEventWriter) will prompt you to configure:
Output File: SQLite file to write to.Experiment Name: Label for identifying this session.Voltage(mV),Membrane Thickness(nm),Conductivity(S/m): Experimental conditions for traceability.
Click the Commit button to write the results into the specified database.